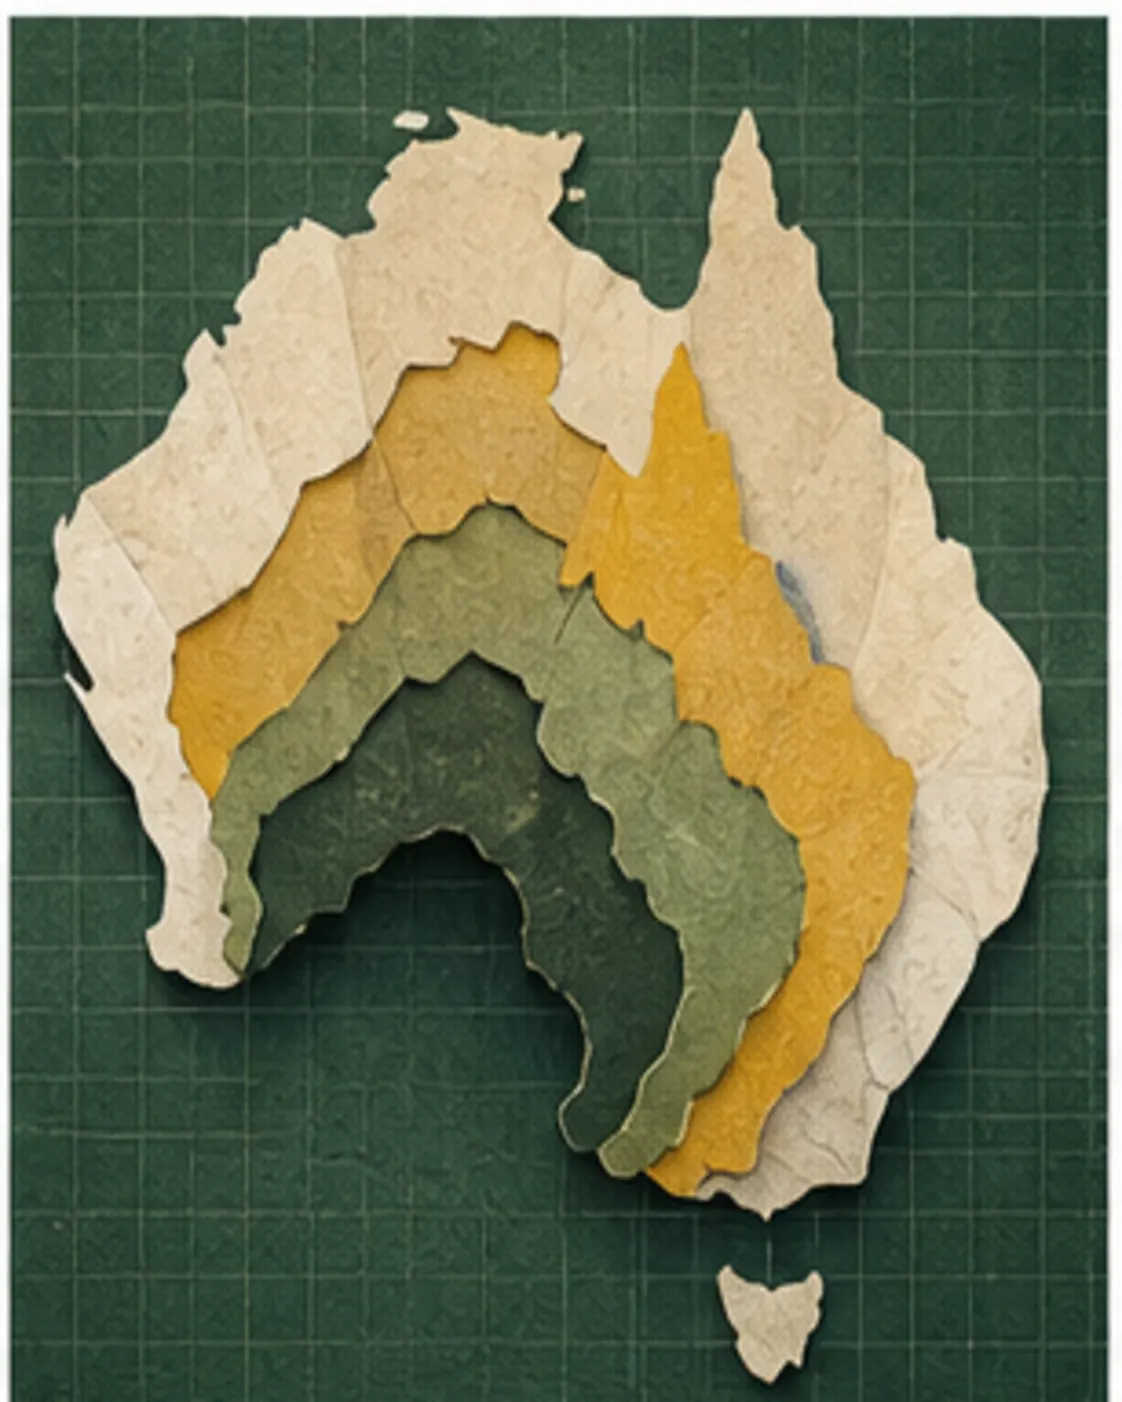
The ABS builds Australian statistical geography from small Mesh Blocks into larger areas designed for different kinds of comparison.
A map made for questions
The Australian Statistical Geography Standard is not one national map with a single correct set of neighbourhoods. It is a hierarchy designed so the ABS can publish and analyse data at useful scales. A small area can support local counts, while larger areas allow more stable comparisons. The boundaries are tools for answering questions about people and communities, not a replacement for cadastral parcels, council law, electoral districts or the way residents describe where they live.
Mesh Blocks are the building pieces
At the base are Mesh Blocks. They are small geographic units designed to cover Australia without gaps or overlaps. The ABS combines them into Statistical Areas Level 1, then into larger SA2, SA3 and SA4 regions. Each level balances detail, population size, data quality and privacy. The nesting makes it possible to aggregate figures consistently, but an SA2 should not automatically be read as a suburb or a local government area.

Different structures answer different questions
The main structure supports broad social and economic analysis. Other ASGS structures approximate electoral divisions, local government areas, postal areas, suburbs and localities. Urban structures identify concentrations of development. Remoteness structures describe relative access to services. These layers may overlap differently because they were designed for different tasks. A resident can simultaneously live in one postcode, another SA2, a council, an electorate and a named locality.
Why editions change
The ABS updates the ASGS every five years to reflect population growth, new infrastructure and changing settlement patterns. Edition 4 began rolling out in July 2026 for the 2026 Census cycle. Some datasets will continue using Edition 3 during transition. That means a time series can show an apparent change caused partly by geography rather than by people. Good comparisons state the edition and, where necessary, use correspondence files to reconcile old and new areas.

Boundaries are not lived experience
Statistical areas are deliberately consistent, but communities are not tidy polygons. A transport corridor can link residents across an SA boundary, while a river or mountain may separate people within one region. The ABS calls the ASGS a social geography, yet it still cautions against using it for administrative or operational purposes without checking fitness. A useful number becomes misleading when the map is treated as more exact than the question allows.
How to read a mapped statistic
First identify the geography in the legend, including its level and edition. Ask whether the measure was collected for that geography or converted into it. Check whether the area is an ABS structure or an approximation of someone else's boundary. Finally, compare like with like. The map is doing more than showing a number. It is defining the unit that the number is allowed to describe.
- Australian Statistical Geography Standard Edition 4, Checked 14 August 2026 for How Australia turns people into statistical maps.
- Using the ASGS, Checked 14 August 2026 for How Australia turns people into statistical maps.
Australia, Actually checked the linked records on 14 August 2026. Claims are limited to what those records establish. Google Trends figures, where used, are rounded attention signals rather than audience totals. Found a problem? See our correction process.